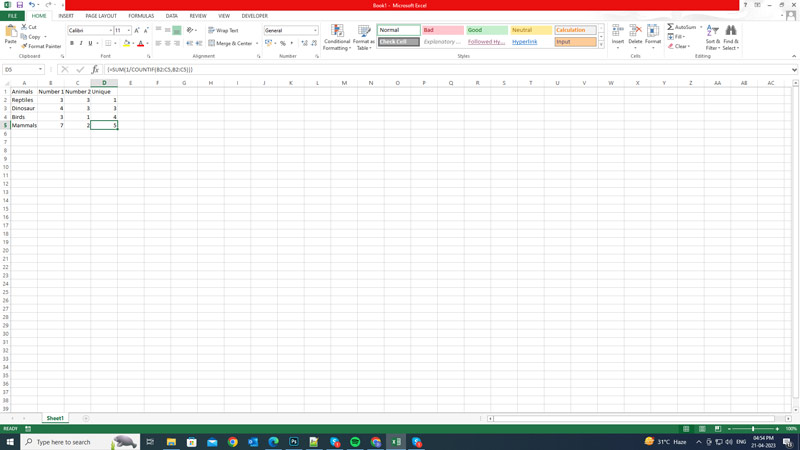
While working on Excel, users might often need to count how many unique or duplicate values are there in the dataset. Counting these values is easy with small datasets. However, when you are working with a large dataset, manually counting values isn’t viable. Fortunately, there are a few ways you can use to count the unique values on your Excel sheet and this guide will help you with it.
Excel: How to Count Unique Values (2023)

To count unique values in Excel, you can use an array formula that combines the COUNTIF and SUM functions. The COUNTIF function counts how many times a value appears in a range, and the SUM function adds up those counts. By dividing 1 by the COUNTIF result, we can get the fraction of each value that is unique. For example, if a value appears twice in a range, its fraction will be 1/2, and if it appears three times, its fraction will be 1/3. Then, by summing up these fractions, we can get the total number of unique values. Hence, to count the unique value, type the following formula:
=SUM(1/COUNTIF(range,range))
- Where “range” is the cell range that contains the values you want to count.
- Press the ‘Ctrl’ + ‘Shift’ + ‘Enter’ keys on your keyboard after entering the cell range in the above formula.
- You will see curly brackets “{}” around the formula in the formula bar, and the unique value numbers will be shown in the selected cells.
Example

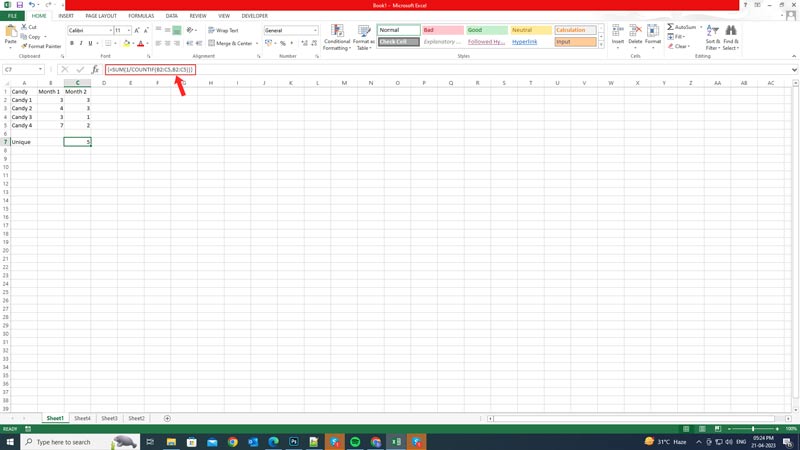
Suppose you want to count how many unique candies you ate in two months, you can use the following formula:
=SUM(1/COUNTIF(B2:C5,B2:C5))
As mentioned in the above figure, this formula will return the value 5, which is the number of unique candies you ate in the range B2:C5.
Hope this guide helps you to count unique values in Excel. Also, check out our other guides, such as How to delete duplicates in Excel or How to unhide rows in Excel.
